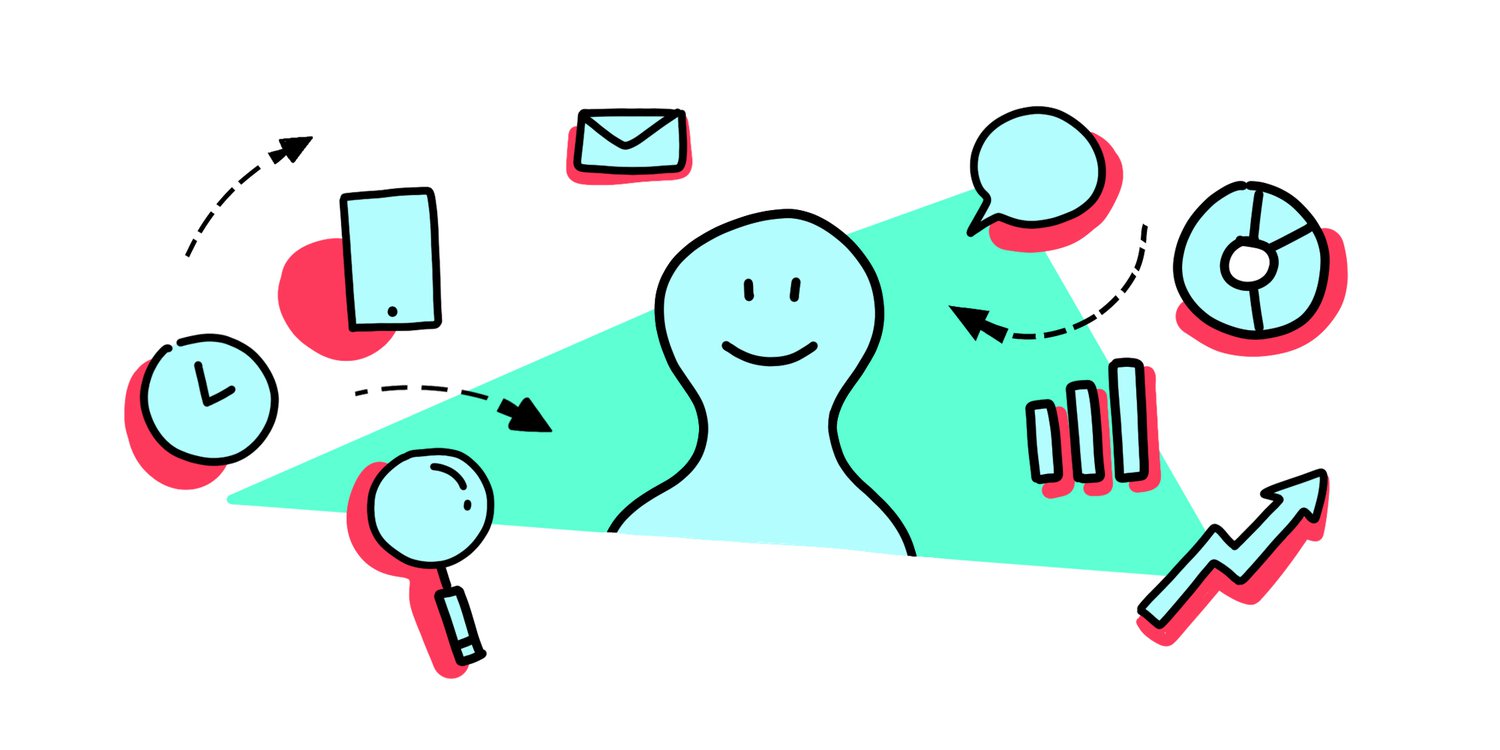
3 reasons to use Hotjar as a designer
We all know that if we understand our users and design for their needs, the business will go up. Google Analytics gives you statistical data on bounce rates, where your users come from, and page-to-page behavior. But what about what happens on the page itself? When the users bounce, why does that happen? Or why are they not purchasing your product?
Enter Hotjar. A tool used to gather behavioral and feedback data on your users. It gives insights into the experience and behavior of the user by creating heatmaps and session recordings. And can also provide feedback through their surveys and incoming feedback widget.
Sounds great right? Here are 3 reasons why you should use Hotjar. Whether you’ve got a website, shop, or web app.
1. Hotjar is based on data, not on opinions
Everyone has opinions on design, some people like minimalistic, others like lots of colors, but what they all have in common is that they are biased opinions. There is no data that suggests that any of these people are right. Hotjar has a built-in survey tool that can give you quick results on the opinions of your actual users, not your colleagues.
These quick surveys provide you with quick quantitative data that doesn’t require any moderation. What’s nice about this is that these can be set up by the UX researcher while your designer is working on something else. And if you need input on the type of questions then Hotjar provides you with a full library of templates.
2. Behavior is portrayed visually
One of my personal favorite features of Hotjar is the session recordings. These recordings get generated by tracking the mouse movements of the user on the page they are using. It gives you quick insights into their behavior, their needs, and what they might be missing. These recordings allow you, as the designer, to take your time looking back at what users did, compare users to one another, and find problems.
One example I found recently in one of our designs was that a user kept moving their mouse across a line at the bottom of a table. There was nothing on that line. However, when looking into it further, I found at that several users were portraying the same behavior. It didn’t take long to understand that these users thought that this particular line in the design was a scrollbar. This finding was then brought back to the product team to discuss further. Should we make it into a scrollbar, and is that what is needed here? Or should the design be changed to eliminate the confusion?
I wouldn’t have been able to find this problem without having a big test group to experiment with. But with Hotjar, I immediately got multiple users showing the same behavior and frustration, which means as a designer, I can solve it.
It’s easy to use
The learning curve of Hotjar is minimal, it’s easy to set up, easy to get into, and even easier to start collecting data. While you focus on other design processes within the company, Hotjar generates data. With the focus on data collection and limited tools the price can stay low, but the quality of the analysis is high.
Conclusion
Where analytics focuses on large quantities of data, Hotjar focuses on behavior and interactions. Thus creating a nice overlap between qualitative and quantitative research. For example, if you need a quick evaluation of a feature, build a mini-survey and create a session recording to understand how your users interact with it and whether or not they are happy with the feature. Hotjar is useful because it removes doubt and opinions within teams because the data will speak for itself.